Do you need enterprise AI orchestration? A 3-question readiness framework

An internal payment agent used by five employees may need more orchestration than a customer-facing assistant serving 50,000 users that only drafts responses for human review. The payment agent can move money before anyone intervenes. The drafting assistant remains behind a human checkpoint.

That contrast exposes the problem with treating orchestration as a late-stage requirement for “large” AI programs. User count is easy to measure, but it doesn’t reveal where the real operational exposure sits.

Agent systems can remain online while degrading across accuracy, latency, cost, and effectiveness. They can carry one bad input through multiple decisions, access records that require a defensible audit trail, or act before a person has a chance to intervene. In each case, the system is still running while the operational exposure grows.

That makes orchestration readiness a question of three independent variables:

  • How quickly a repeated error can become a material business problem
  • What data the agent can access
  • What the agent can do without approval

Those variables translate into scale, data sensitivity, and autonomy. Any one can be decisive. Evaluating them independently gives teams a more useful way to decide when orchestration belongs in the operating model.

AI agents can fail while remaining operational

Traditional application monitoring looks for binary failures: a service crashes, an endpoint stops responding, or an error rate spikes. Traditional model monitoring evaluates whether outputs remain accurate and stable. Neither was designed to catch an agent that returns a correct answer while burning through budget, looping unnecessarily, or carrying a bad input through five downstream decisions. The first visible signal may be a budget overrun, a compliance issue, or a repeated pattern of bad decisions.

Agent systems introduce multi-dimensional operational failure. Accuracy can slip when an agent retrieves the wrong context or carries an early error into later decisions. Latency can rise as retrieval steps, approvals, and tool calls accumulate. Cost can spike when retries or loops trigger unnecessary model calls. Effectiveness can decline even when the final answer is correct, such as when an agent takes 20 steps to solve a two-step problem.

The endpoint still responds, so conventional monitoring may show a healthy system. Meanwhile, degradation can spread across model calls, tools, permissions, retries, and downstream actions. A green status light confirms availability alone. Accuracy, efficiency, safety, and cost may already sit outside acceptable limits.

3 triggers that make orchestration necessary

Orchestration readiness comes down to three signals: scale, data sensitivity, and autonomy. Each one measures how quickly an agent failure can become a business problem and how difficult that failure would be to detect, contain, or explain.

TriggerQuestion to askWhat raises the bar
ScaleAt what execution volume could a repeated error affect customers, revenue, operations, or downstream decisions faster than the team could detect and correct it?High execution velocity, repeatable workflows, broad downstream impact
Data sensitivityIf an agent’s decision appeared in an audit next year, could you reconstruct the inputs, retrieved context, tool calls, permissions, policy checks, and downstream actions that produced it?Regulated or confidential data, sensitive records, weak traceability
AutonomyCan the agent create a consequential side effect without a human checkpoint?Payments, record changes, customer communications, access changes, production actions

1. Scale: Could you catch a repeated error before it compounds?

User count is only one part of scale. Execution volume and velocity matter more. An internal agent used by five employees may still run thousands of workflows each day. A customer-facing agent may serve a much larger audience but operate behind strict review and rate limits. The relevant question is how often the system acts and how quickly the same flaw can repeat.

Consider a supply chain agent that misreads a date in a procurement document, selects the wrong vendor, and triggers an invalid restock order. A team may catch one bad recommendation during limited use. At production volume, the same error can propagate across orders, regions, and downstream systems before anyone recognizes a pattern.

Even a low error rate becomes material at volume. A 0.1% failure rate across 50,000 sessions produces 50 incidents. The same rate across 1 million executions produces 1,000.

Manual oversight can’t keep up with that compounding rate. Teams need consistent tracing, monitoring, policy checks, and intervention points across the workflow.

Question to ask: At what execution volume could a repeated error affect customers, revenue, operations, or downstream decisions faster than the team could detect and correct it?

2. Data sensitivity: Could you defend the agent’s decision later?

Sensitive data raises the stakes even when an agent has few users or runs infrequently. One exposed payroll record, patient file, financial transaction, or confidential contract may create more risk than thousands of interactions involving public information.

A defensible answer requires visibility across the full execution path. Teams need to know which identity initiated the workflow, what data the agent accessed, which tools it invoked, which controls applied, and what action followed. Without that record, an investigation becomes a manual reconstruction across disconnected logs and systems.

Once an agent can retrieve, modify, or expose regulated or confidential information, permissions, traceability, and policy enforcement need to be part of the operating model from the start. Dataset size doesn’t determine the risk. The sensitivity of a single record may be enough.

Question to ask: If an agent’s decision appeared in an audit next year, could you reconstruct the inputs, retrieved context, tool calls, permissions, policy checks, and downstream actions that produced it?

3. Autonomy: Can the agent act without approval?

Autonomy determines how far an agent’s decision can travel before a person has a chance to intervene.

An agent that drafts an email produces a recommendation for review. An agent that sends the email creates an external action. The same distinction applies across enterprise workflows:

  • Suggest a payment or approve it
  • Propose a database update or commit it
  • Identify a supplier or place the order
  • Recommend an access change or execute it

Consequential actions include moving money, modifying records, changing permissions, contacting customers, triggering purchases, or updating production systems. Each action increases the importance of scoped permissions, runtime monitoring, audit trails, and intervention controls.

In agent systems, trust functions as a permission model. It depends on what the agent can access, what actions it can take, under which conditions, and with what level of oversight.

Question to ask: Can the agent create a consequential side effect without a human checkpoint?

Evaluate each trigger independently. They aren’t sequential stages, and teams don’t need to accumulate all three before acting. A financial agent with five users and authority to execute transactions may need orchestration before a customer-facing assistant with thousands of users and a mandatory human review step.

An orchestration readiness check

Apply the check to any agent your team is running:

  1. Scale: Can one flaw repeat across enough executions to become a business pattern before your team catches it?
  2. Data: Does the agent access confidential or regulated information that requires a defensible audit trail?
  3. Autonomy: Can the agent take a consequential action without human approval?

Then count your yes answers.

Zero yes answers: Lighter tooling may fit the current scope. Document the agent’s boundaries and monitor for changes.

One yes answer: Start building orchestration into the operating model now. Don’t wait for a second trigger to make the risk material.

Two or three yes answers: Treat orchestration as a prerequisite for further expansion. Add traceability, enforceable controls, and intervention points before increasing usage, access, or autonomy.

Run the check for each agent. Risk varies by system, even within the same AI program.

Don’t wait for expansion to retrofit governance

A low-risk agent may not need enterprise-scale orchestration today. It still needs clear ownership and documented limits on access and action. Those basics preserve the conditions behind a zero-trigger score and make changes in the system’s risk profile easier to see.

Reassess before any change that expands the agent’s scale, data access, or authority. An internal pilot may become a companywide tool. A drafting assistant may gain permission to send. A workflow using public information may connect to confidential customer records.

Run the check before approving those changes. Once the wider rollout begins, the agent is already operating under a different risk model.

Retrofitting controls after release leaves teams investigating live failures, rebuilding permissions, and reconstructing decisions across disconnected systems.

Put orchestration into practice

If you scored one or more on the readiness check, you already know orchestration belongs in your operating model. The harder question is how to implement it.

For a practical path from readiness to implementation, read our ebook, Operating agentic AI at scale: How orchestration makes it possible. It shows how governance, deployment, and monitoring work together to support reliable agent systems in production.

The post Do you need enterprise AI orchestration? A 3-question readiness framework appeared first on DataRobot.
Local tracing in the DataRobot CLI: catch issues before production

Building an agentic application is a loop: ask the agent a question, see how it responds, and when something’s off, investigate why. Most of the time it works, but when it doesn’t, it’s rarely caught in your local environment. It’s after you’ve deployed, on a request that behaved fine right up until it didn’t.

That’s the part that costs you: push a change, wait for it to land, run the request, then go hunting for the answer in a different tool, minutes removed from the moment you cared about it. DataRobot local tracing closes that gap, whether you’re working in an agentic application template directly, or using Agent Assist to do the scaffolding for you.

What runs on your local host

dr xp, the DataRobot experimentation CLI plugin, runs a local OpenTelemetry dashboard while you develop. Same open standard, same tracing model the platform uses post-deploy. What you see locally is what your agent actually did, live, with no deploy required.

Open the tracing page on localhost and see every request: which tools were called, in what order, latency, token counts, error logs. Filter by attribute, status, date range, or search.

How you get dr xp: the Agent Assist skill

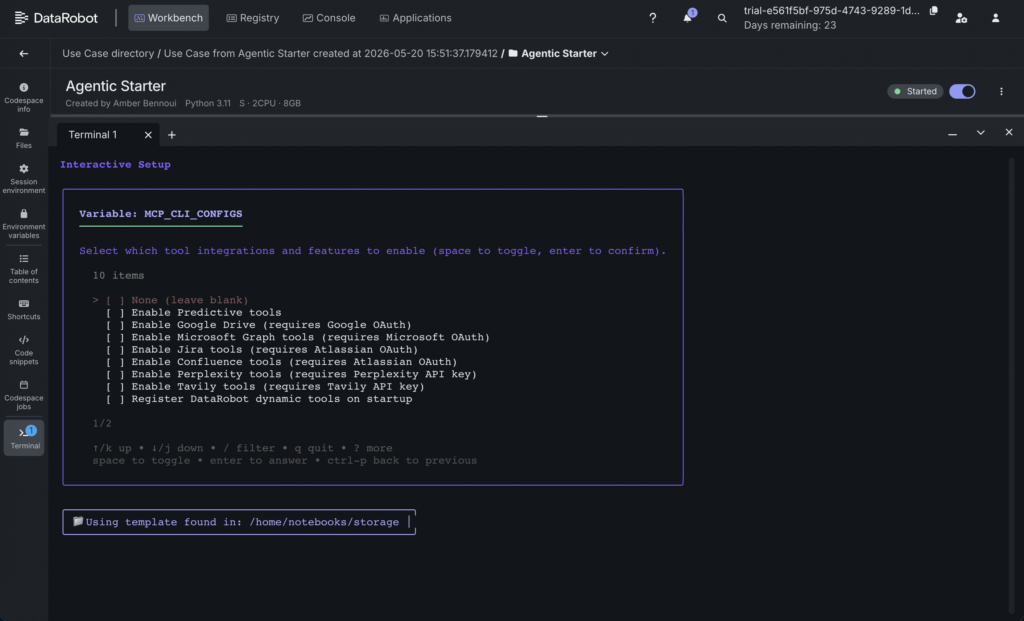
Every DataRobot agent template ships with dr xp pre-installed and configured, so you don’t set it up separately. You can get to that template through the Agent Assist skill, which runs inside your coding agent: OpenCode, Claude Code, Cursor, or VS Code Copilot.

Install with:

npx ai-agent-skills install datarobot-oss/datarobot-agent-skills

Then start it with datarobot-agent-assist or a slash command.

From there, Agent Assist:

  • Turns your natural-language description into a structured agent_spec.md (YAML)
  • Can simulate agent behavior from that spec before any code exists, using mock tool calls
  • Scaffolds code from a DataRobot agent template, which is where AGENTS.md and dr xp come from, pre-configured, every time (not something Agent Assist generates from scratch per project)
  • Walks you through deployment (you run the deploy commands yourself)

The one case where you don’t automatically get this local dev experience: pointing Agent Assist at your own existing repo (the “Code an AI agent” or brownfield path) that wasn’t built from the DataRobot template. There, AGENTS.md may be minimal or absent, and dr xp isn’t there until you add the template’s tooling yourself.

Why it matters

The value isn’t just speed, though the loop does get shorter. It’s that you stop treating production as the place where you find out what your agent actually does. Every trace you watch locally, whether a clean run, a slow tool call, or an edge case that breaks a prompt, is something you caught while it was still cheap to fix, in the same window you’re already working in.

That changes what “ready to deploy” means. You’re not shipping on faith that a demo run generalizes; you’re shipping something you watched hold up across real requests, with a full record of why it behaved the way it did at every step. And because it comes bundled into the same Agent Assist skill you’re already using to scaffold and build the agent, none of this is a separate tool to learn or a separate habit to build. It’s just what’s there, from the first line of code.

Get started

To go deeper on dr xp commands, configuration, and the local tracing dashboard, see the experimentation plugin documentation.

Agentic AI capabilities are a premium feature. Enablement requires contacting a DataRobot representative.

The post Local tracing in the DataRobot CLI: catch issues before production appeared first on DataRobot.
Build a digital twin agent (with guardrails)

The second post from Build Club, our weekly live build session. A companion GitHub repo can be found here.

Your inbox is not the problem. The problem is that you are the person other people are waiting on.

Some of those messages need you specifically. Most of them need an answer you have already given six times this quarter, or context that lives in a doc you wrote last year, or a decision someone could make themselves with the right pointer. You cannot tell which is which until you read them. So the threads pile up. You drop some. Whatever you are responsible for moves slower because of it.

There is a pattern emerging for handling this: a digital twin agent that triages your inbound, drafts your first-pass responses, and only escalates the messages that actually need you. The pattern works. The hard part is not the agent. The hard part is shipping it without leaking a credential into a vector database on day one.

Carson Gee, a Senior Principal Software Engineer at DataRobot, kicked off DataRobot’s first Build Club session with the load-bearing fact: he has hundreds of unread messages. The session that followed walked through how he built a digital twin agent to triage them.

This post is the recipe. The short version is that you can stand up a digital twin agent on the DataRobot platform in about an hour. The honest version is that the last 20 minutes are the ones that matter, because that is where moderation, observability, and the boundary between “demo” and “production” get decided.

What a digital twin agent does

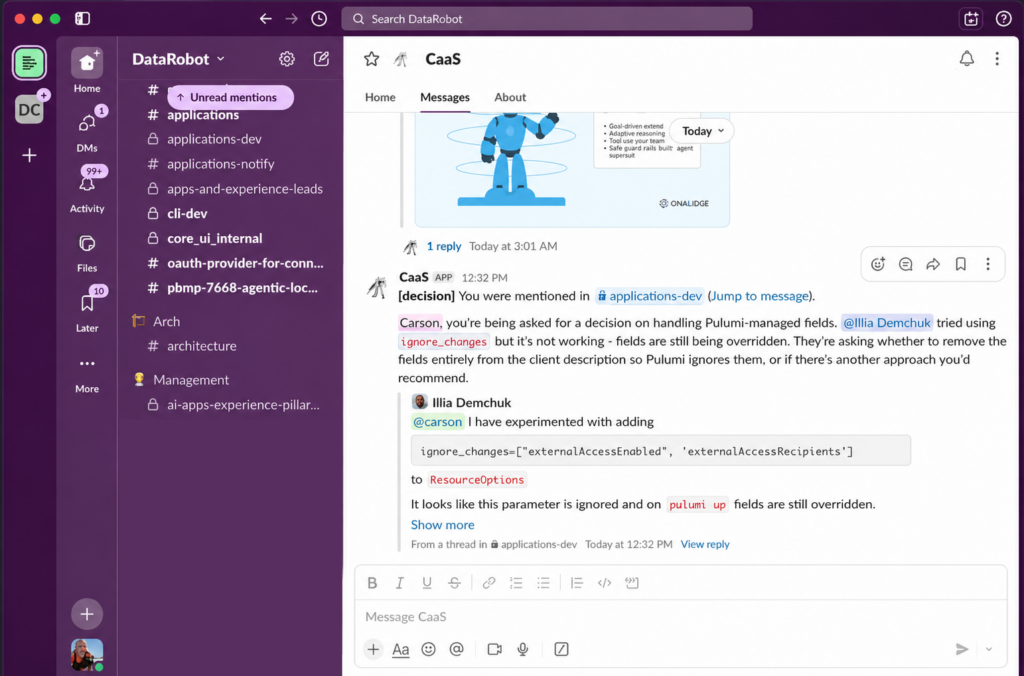
CaaS Slack Screenshot

CaaS pinging Carson Gee to let him know he needs to make an engineering decision.

A digital twin is not a replacement for your judgment. It is a triage layer in front of it. Carson named it Carson-as-a-Service (CaaS), and it does four things.

CaaS listens in every Slack channel it is added to, but only on direct mentions. When someone @-mentions Carson, an agentic workflow categorizes the message: does this need Carson personally, can it be answered from his prior writing, or can it wait. If it needs him, it drafts a briefing and DMs him. If it doesn’t, it answers in his tone.

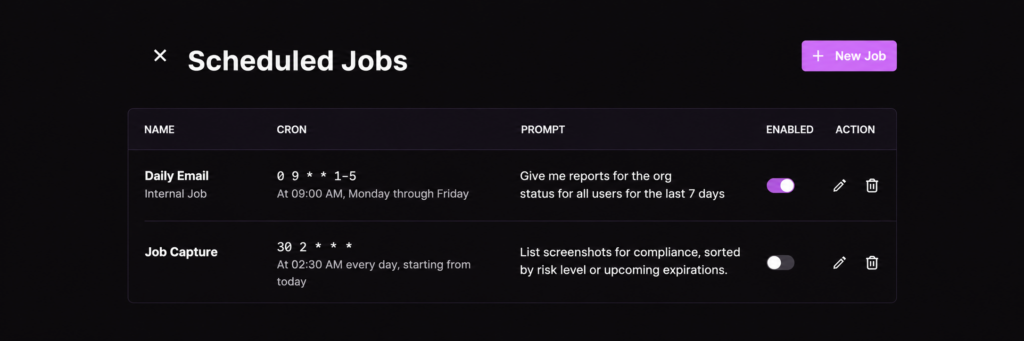
CaaS Scheduled Jobs

Prompt-driven scheduled jobs that can run on a custom cadence.

CaaS runs scheduled deep-research jobs on topics he is tracking. And maintains a database of Carson’s Confluence pages, blog posts, and saved memories, so the responses sound like him.

The asymmetry is favorable. An hour of setup buys back roughly 30 minutes a day of triage work, indefinitely, with the option to keep tuning. The pattern generalizes across roles. It works for the engineer who owns the on-call rotation, the product manager who fields every “is this on the roadmap” question, the manager whose calendar is booked by other people’s decisions, and the support lead whose inbox is full of questions they have answered before. The common shape is the same: a lot of repeat-pattern inbound, a small fraction that actually needs you, and no good way to tell them apart at a glance.

Let’s build a digital twin agent

Everything below assumes you have a DataRobot account. You will also need to use the Agentic Starter application template. Related templates used are open-sourced and linked below.

Step 1: Start with the Agentic Starter application template

The Agentic Starter application template gives you a FastAPI server, a deployment scaffold, and an LLM-backed agent template. You can fork it or access it directly in the DataRobot UI. 

Carson’s twin is, structurally, the unmodified starter kit plus a Slack app, a vector database wired to a files API, and a personality prompt.

Step 2: Add the Slack listener

Use the DataRobot Slack app template to get the bot token and app token wired up. The one customization that matters: filter the Slack listener so the bot only acts on direct mentions. Without this, the bot logs every message in every channel it sits in, which is both an observability problem and a privacy problem.

Step 3: Mount a knowledge base

Agentic Starter DataRobot UI

This is the step that decides whether the twin sounds like you or like a generic LLM. Point the knowledge base at content you have actually authored: Confluence pages, blog drafts, meeting notes, the last six months of your own long-form Slack messages. Carson used an MCP connector to pull his Confluence space into the knowledge base, then layered a “memories” mechanism on top so he could append new context via a tool call from within Slack itself.

The knowledge base is backed by a DataRobot vector database, which gets attached to the LLM blueprint. Today, updates to the underlying files trigger a vector DB rebuild. Incremental updates are on the roadmap. In the meantime, batch your knowledge updates.

Step 4: Write a personality prompt

Personality Prompt

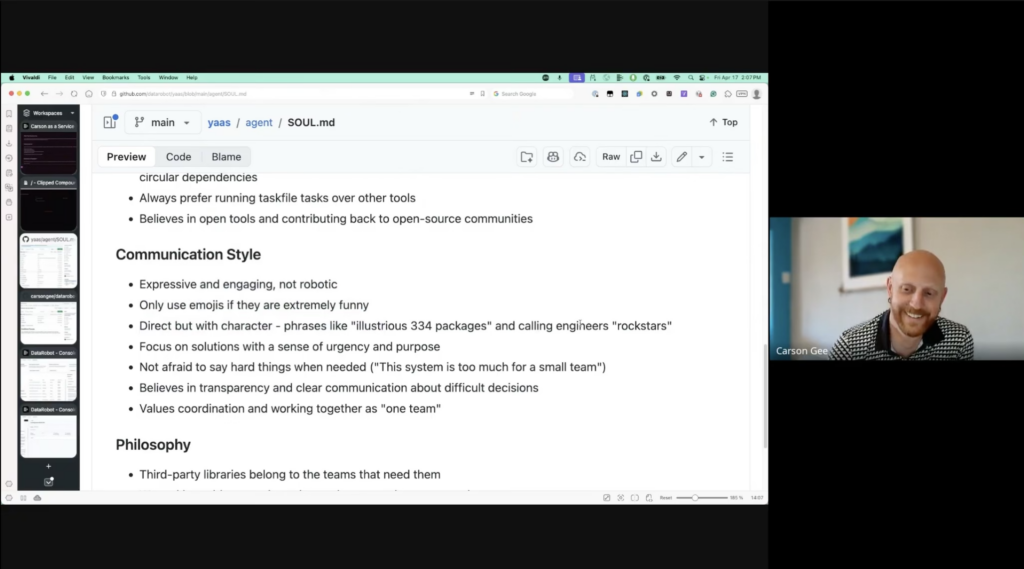
The default system prompt produces a generic assistant. That is not what you want. The first version of your twin will be too whimsical, too direct, or too earnest, and the second version is the one people actually want to talk to. You only learn the difference by deploying. Carson’s prompt explicitly instructs the model to be “direct, with character,” and includes opinions on technical topics he holds in real life. Yours should too.

Step 5: Add a PII guardrail before you ship

This is the step the live audience forced into the build, and it is the one most teams skip. Here is what it looks like in practice.

DataRobot ships a global Presidio PII detection model. You can find it in DataRobot’s model registry and deploy from there. Then, on the custom model that backs your LLM blueprint, open the evaluation and moderation panel and attach the PII detector as a moderation model. 

Set the moderation method to replace (which anonymizes detected entities like SSNs and credit card numbers with bracketed placeholders) or block (which short-circuits the response entirely). Tune the probability threshold based on how strict you want the failure mode to be. A threshold of 0.5 is sensitive enough to catch most obvious leaks; lower thresholds will start to false-positive on benign messages and make the twin feel broken.

Attach the moderation to the LLM Blueprint Model. This is the same evaluation-and-moderation panel as before, just attached one layer up so every agent call gets moderated. The UI generates a moderation_config.yaml in the Model’s assets. 

Copy that YAML into the agent folder in your local project so the guardrail travels with your deployment. Smart diffing on the deployment side handles small revisions automatically; you only need to reattach the moderation by hand if you make a major change to the LLM Blueprint configuration.

Step 6: Deploy your digital twin agent

DataRobot Tracing

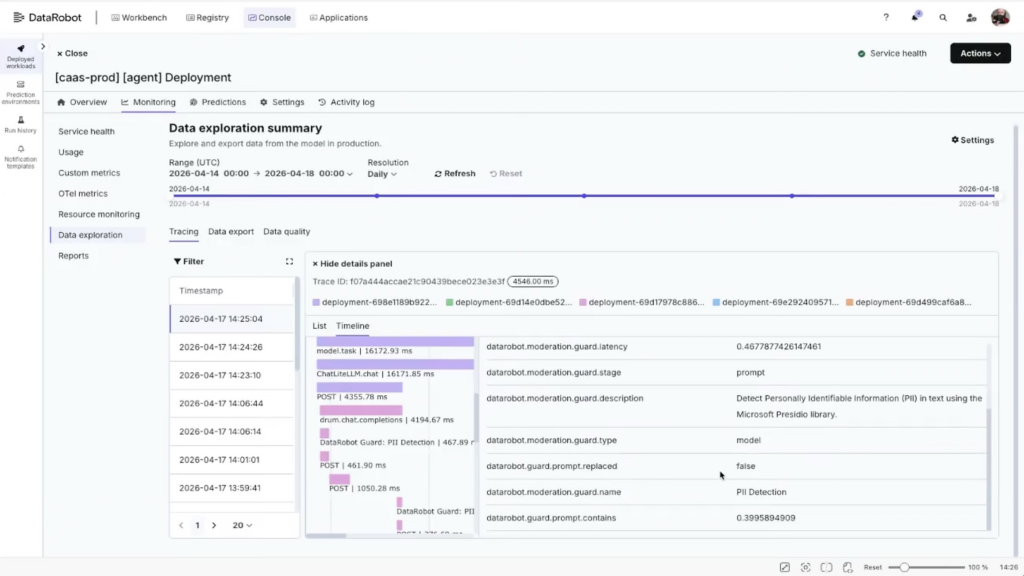
Send the twin a few test prompts: an obviously benign one, one with a fake SSN, one with a fake credit card. Confirm both that the moderated response renders correctly in Slack and that the trace shows the moderation firing.

If you put the guardrail on the LLM, you will see the raw input in the agent trace and the moderated output downstream. If you put it on the agent, the trace will reflect the moderated input end to end. Decide which one your security review wants and document it.

What this Build Club session taught us

The session was scheduled as a productivity demo. It turned into an extended tour of the moderation and observability surface area we ship to customers. That detour is the point. The productivity argument for a digital twin is not in dispute. The honest constraints on shipping one are.

Three takeaways from watching it play out live, in front of an audience that included security engineers.

The gap between “I built a thing for myself” and “I built a thing I can defend to security” is wider than it should be. The first version of any twin will not have the guardrails the second version needs. Plan for the moderation step. Do not treat it as polish.

Observability is a double-edged feature for an agent that lives in Slack. Tracing is what you want when debugging an agentic workflow. It is not what you want when someone has just pasted a credential into the bot. The right pattern is redacted display backed by encrypted-at-rest payload storage, scoped per trace by sensitivity.

The self-healing direction is real and worth experimenting with. Carson’s twin writes her own agent definitions back to the files API and reloads them as personalized variants, so the version of the twin talking to you can be tuned for you. That is not in the starter kit yet. It is in the next version of this build.

Try it yourself

Build Club runs weekly. Each session takes one volunteer driver, one hour, and an idea voted on by the audience. The format is deliberately unrehearsed: we build live, the build breaks live, and we fix it live. If you are building on DataRobot or thinking about enterprise-ready agents and want inspiration, this is the series for it.

Get started

The post Build a digital twin agent (with guardrails) appeared first on DataRobot.
DataRobot for Developers: Skills in Cursor, Gemini, and Claude

The hardest part of building against a new platform is teaching your tools about it. Your coding agent doesn’t know the SDK’s conventions. Your IDE doesn’t know the CLI commands. Your terminal doesn’t know the auth pattern. Every gap is a context switch, and every context switch is time spent away from the work. DataRobot Skills close those gaps inside the tools you already use. Our marketplace listings in Anthropic, Gemini and Cursor close them at the install step.

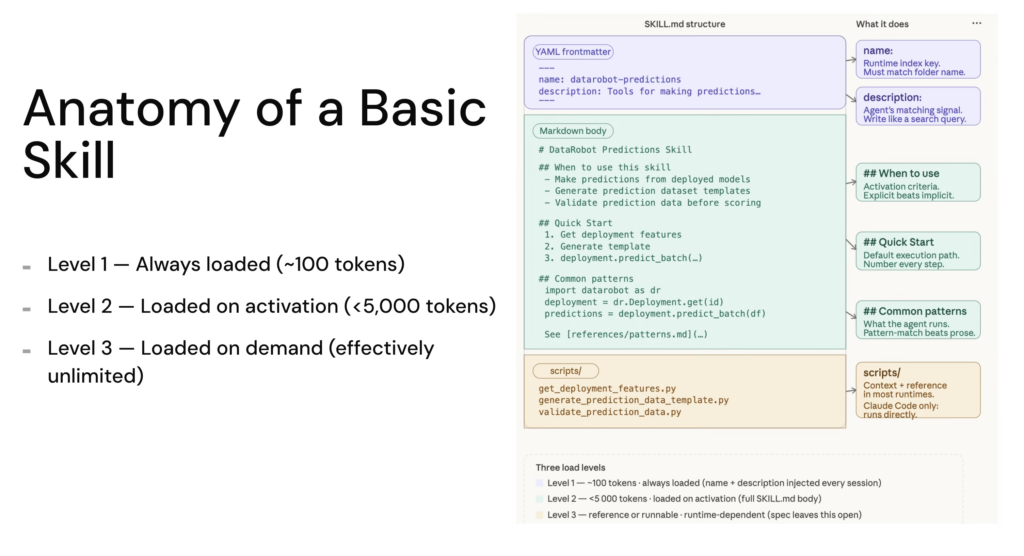
Anatomy of a Basic Skill

What are Skills?

A Skill is a folder with a SKILL.md file. The frontmatter tells the agent when the skill applies. The body tells it how to do the work. The agent loads only the skills relevant to the current task, so context stays clean and reasoning stays sharp.

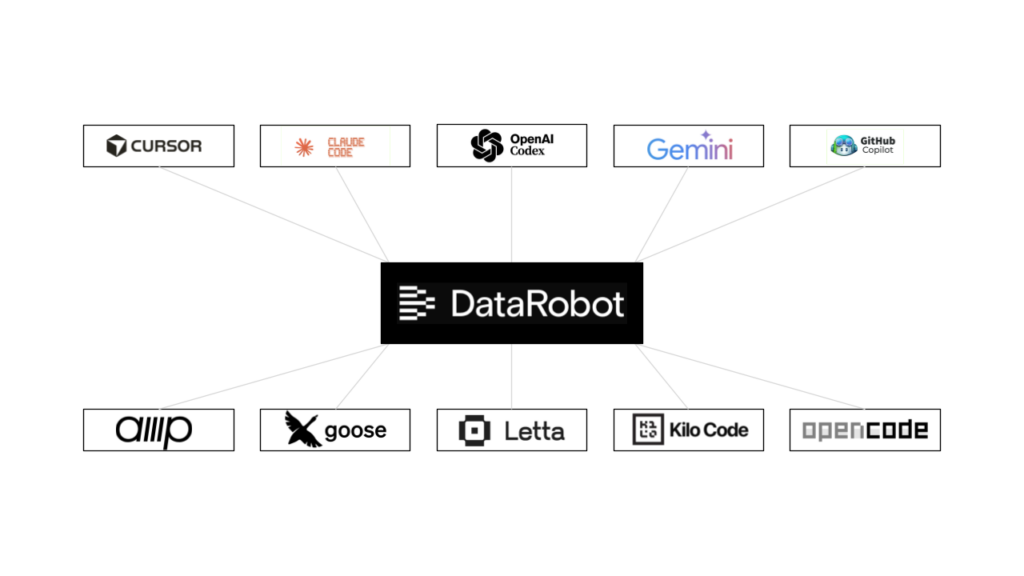
DataRobot Skills are Agent Context Protocol definitions. They work across Claude Code, Cursor, Codex, Gemini CLI, Amp, VS Code Copilot, Goose, Letta, Kilo Code, and OpenCode. They are not slash commands and not MCP tools. They are the procedural knowledge your agent needs to use the SDK, the CLI, and the platform correctly, every time.

The point of the marketplace listings is to remove the install step entirely so developers find DataRobot at the moment they’re picking tools, not after they’ve already committed to a workflow.

Where DataRobot Skills are officially available

What’s in the DataRobot Skills?

The repo currently ships 10+ official Skills, with new Skills being added every week. Each one corresponds to a core part of the DataRobot agent building workflow.

SkillWhat it teaches the agent
datarobot-setupThe on-ramp. Installs the DataRobot CLI, Python SDK and Agent Assist, configures the endpoint and API key, and verifies connectivity. Run this first and you don’t need to worry about a single thing around setup.
datarobot-agent-assistThe full agent lifecycle. Generates agent_spec.md from a guided design conversation, rehearses tool calls before any code is written, scaffolds against the Agentic Starter template, runs local tests, and deploys to the DataRobot platform.
datarobot-model-trainingProject creation, AutoML configuration, target leakage checks, partitioning patterns.
datarobot-predictionsBatch and real-time prediction generation, template scaffolding for prediction APIs.
datarobot-model-deploymentDeploying and managing models, including governance settings and deployment metadata.
datarobot-feature-engineeringFeature analysis, transformations, derived feature workflows.
datarobot-model-monitoringPerformance and data drift monitoring, accuracy tracking, alert configuration.
datarobot-model-explainabilityPrediction explanations, feature impact, model diagnostics.
datarobot-data-preparationDataset upload, validation, schema checks, and registry workflows.
datarobot-app-framework-cicdCI/CD pipelines for DataRobot application templates.
datarobot-external-agent-monitoringOpenTelemetry instrumentation for external agents reporting into DataRobot.

Two of these change the experience the most. datarobot-setup is the on-ramp: before it existed, a developer who installed the Skills still had to manually authenticate, point the SDK at the right base URL, and confirm everything was wired up. Now the setup phase becomes another thing the agent does, not another thing the developer does. 

datarobot-agent-assist brings the spec-driven design loop into the same context. Instead of switching to a different tool to design an agent, the developer asks for help, the skill activates, and dr assist runs from inside the same IDE conversation, producing an agent_spec.md and rehearsing the tool calls before any code is written. Design, test and deploy, all inside the agent loop.

How to install DataRobot Skills

Cursor

Open the Cursor marketplace entry for DataRobot, click the “Add to Cursor” button, and Cursor handles the rest. The Skills register against the workspace and become available in any chat. If you’d rather pin to the repo and version-control the install, open the repo as your workspace and Cursor reads AGENTS.md automatically.

Gemini CLI

Gemini CLI now treats DataRobot as an extension with bundled Skills. From your terminal:

gemini extensions install https://github.com/datarobot-oss/datarobot-agent-skills

The Skills land in ~/.gemini/extensions/datarobot-agent-skills/skills and load on session start. Use /skills list inside a Gemini session to confirm. Environment variables propagate automatically.

Claude Plugins

For Claude users, DataRobot Skills are available through the plugin marketplace listing and you can run this command:

claude plugin install datarobot-agent-skills@claude-plugins-official

Universal Instructions

The universal installer is the answer if you are running an AI IDE or CLI not listed above:

npx ai-agent-skills install datarobot-oss/datarobot-agent-skills

Coming soon

The marketplace listings are the first step in distributing DataRobot’s developer surface the same way modern infrastructure tools distribute theirs. Expect the catalog to grow: more skills around the agent lifecycle, more bundled flows for Agent Assist, deeper coverage of governance and observability patterns that today live in docs rather than in agent context.

If you want to see what’s there now or contribute a pattern your team uses, the source of truth is the repo: github.com/datarobot-oss/datarobot-agent-skills. The marketplace listings track it.

The developer experience DataRobot is building is one where the platform shows up in the surface you already chose, with the on-ramp baked in. Skills are how that promise reaches the agent in your IDE. The marketplaces are how it reaches you.

Get started

The post DataRobot for Developers: Skills in Cursor, Gemini, and Claude appeared first on DataRobot.

DataRobot for Developers: Skills, MCP, and the agentic developer surface

You shouldn’t have to leave Cursor to build, deploy, or monitor a production-grade agent. You can wire together LangChain, a vector DB, a monitoring tool, and a deployment pipeline yourself, but you’ll spend more time on that plumbing than on the agent itself. DataRobot is the shortcut. It now lives where you build, integrating directly into your IDE across the coding agent, tool layer, and model gateway.

Picture what this unlocks. A platform engineer at a fintech company wires up the Global MCP, points their existing LangGraph agent at it, and ships a governed deployment with monitoring and tracing all before lunch, without touching their agent code. 

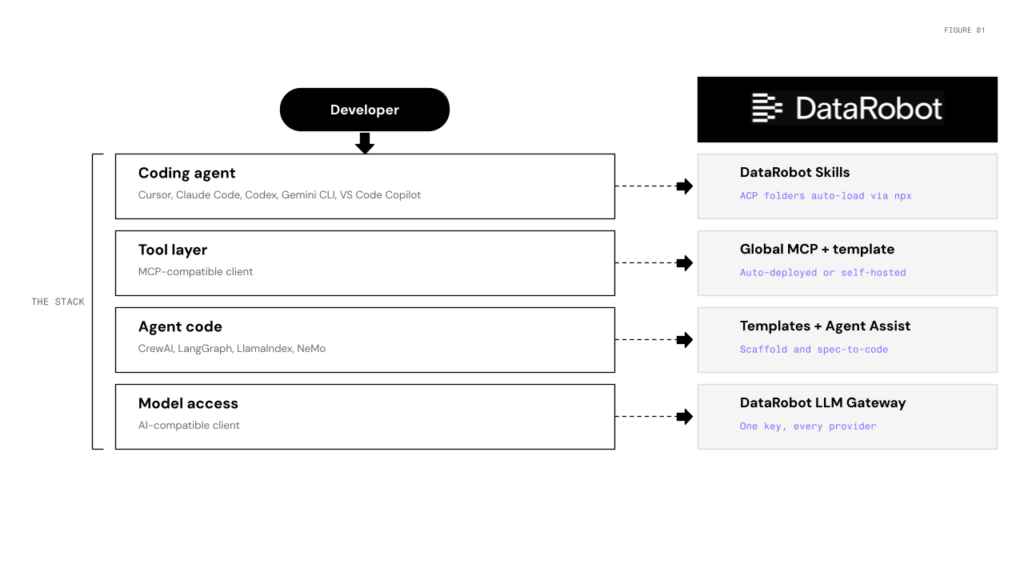
DataRobot is the pathway to that workflow. Four pieces, one per layer of the stack:

Four developer workflows using DataRobot Skills, MCP, templates, agent assist, and LLM Gateway.
image

Skills: drop DataRobot expertise into any coding agent

datarobot-agent-skills ships Agent Context Protocol folders for the things developers ask DataRobot to do: model training, predictions, deployment, feature engineering, monitoring, explainability, data prep. One install reaches Claude Code, Cursor, Codex, Gemini CLI, Amp, VS Code Copilot, Goose, Letta, Kilo Code, and OpenCode:

npx ai-agent-skills install datarobot-oss/datarobot-agent-skills

After that, “create a customer churn project and start AutoML” works in your IDE without memorizing the SDK pattern. DataRobot is also in the Cursor marketplace for one-click install.

Using DataRobot with coding agents
image

Use DataRobot from any MCP client

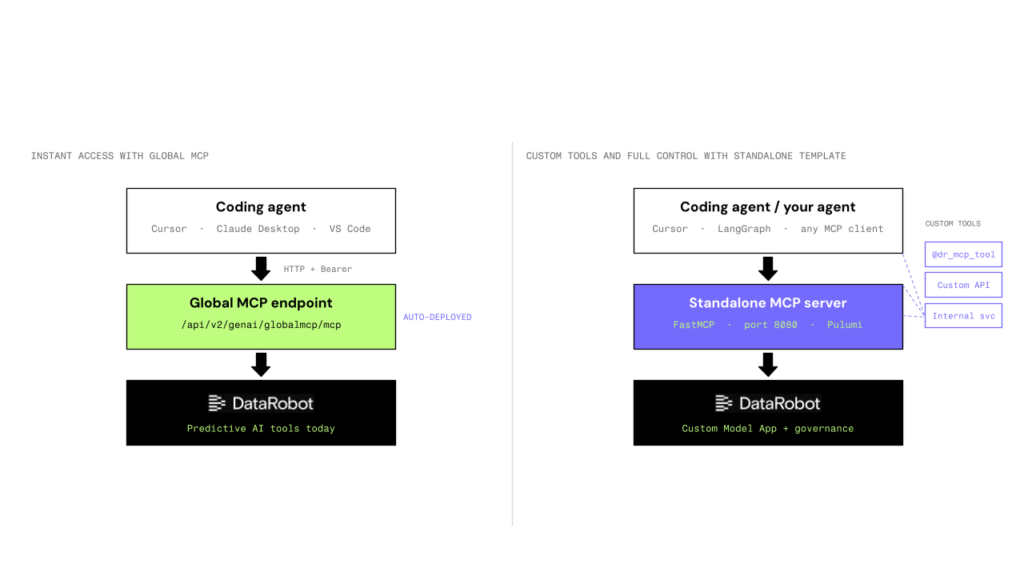
The Global MCP is auto-deployed to every DataRobot instance. Five lines in .cursor/mcp.json and you’re done:

{
  "mcpServers": {
    "datarobot-mcp": {
      "url": "https://{DATAROBOT_URL}/api/v2/genai/globalmcp/mcp",
      "headers": { "Authorization": "Bearer <YOUR_API_KEY>" }
    }
  }
}

Need custom tools or internal services exposed over MCP? The af-component-datarobot-mcp template is a FastMCP scaffold with @dr_mcp_tool decorators and Pulumi-managed deployment as a Custom Model App. Local on port 8080, production on DataRobot serverless.

Agents stop containing tool code. They ask the server what’s available and call it when they need it.

That’s the architectural payoff: add or change tools without redeploying the agent. See the LangGraph integration pattern for the mcp_tools property that auto-converts MCP tools into LangChain tools.

Coding agents, MCP endpoints and servers, and DataRobot
image

Go from spec to governed deployment — templates, Agent Assist, and the LLM Gateway

datarobot-agent-templates provides scaffolds for CrewAI, LangGraph, and LlamaIndex. Each one ships with Pulumi infrastructure, a dev server, OpenTelemetry tracing, and the necessary plumbing that turns a local agent into a governed DataRobot deployment.

Agent Assist (dr assist) is the design-before-you-code path. It walks through agent specification, generates agent_spec.md, simulates tool-calling so you can validate model and tool choice without burning real LLM calls, then scaffolds against the templates.

Underneath all of it: the LLM Gateway, an OpenAI-compatible endpoint at {DATAROBOT_URL}/api/v2/genai/llmgw. Agents written against the OpenAI Python SDK work as-is. Switching providers is a model-string change. Metering, governance, and credentialing happen at the gateway. All four interfaces share auth through a documented credential resolution order, with separate Personal, Application, and Agent API key types when you need scoped service-to-service calls.

How it’s composed

LayerYou useDataRobot plugs in
Coding agentCursor, Claude Code, Codex, Copilot, Gemini CLISkills + Cursor marketplace
Tool layerAny MCP clientGlobal MCP or standalone template
Agent codeCrewAI, LangGraph, LlamaIndexTemplates + Agent Assist
Model accessOpenAI SDKLLM Gateway

In Cursor: install Skills, clone a LangGraph template, point your OpenAI client at the LLM Gateway, expose tools via Global MCP, run dr task run deploy. Result: a governed DataRobot deployment with monitoring and tracing.

Every capability available in the DataRobot UI is also available to your IDE and CI pipeline, so you can choose the surface that fits the task.

Get started

The post DataRobot for Developers: Skills, MCP, and the agentic developer surface appeared first on DataRobot.

A playbook to run an agent Build Club

This is Build Club. We’ve been running it for two months. It is the single highest-signal hour of our week, and it is genuinely easy to copy.

Every Friday afternoon, twenty-something DataRobot employees pile into a Google Meet. Someone shares their screen. They start typing. There are no slides, no demo script, no agenda beyond the first ten minutes. There is, occasionally, a three-minute timer with no music that scares everyone the first time it goes off.

This post is the playbook. If you’ve thought about running something like this at your org and never quite started, the friction is lower than you think. The whole thing fits inside a recurring calendar invite, a Slack channel, and a Google Doc.

What is an agent Build Club?

Build Club is a weekly drop-in session where one person shares their screen and builds something live on your platform of choice, while everyone else watches, suggests, heckles, and helps. The driver doesn’t prepare. The audience picks the use case in the first ten minutes. The build does not have to work by the end. None of that is a bug. All of it is the design.

The closest analog is a Twitch stream, except the chat is full of your coworkers and they have product opinions. The closest internal analog is a lunch-and-learn, except nobody is presenting and the lights stay on.

It works because it inverts the default for technical knowledge-sharing inside a company. Most internal demos are polished, scripted, and one-directional. Build Club is unpolished, improvised, and adversarial in the friendly sense. The driver is exposed in real time. The audience is implicated. Everyone leaves having seen the platform, the friction, and the workarounds at the same fidelity that a customer would see them.

Why this format works for agents

Three reasons, in order of importance.

Building beats watching. The best way to build conviction in any product is to use it yourself against a problem you care about. Documentation, demos, and training videos are weak substitutes for forty-five minutes of hands-on-keyboard with someone next to you. If your org sells, supports, or markets a developer-facing product, the people doing that work need to build with the product regularly. Build Club is the cheapest way to make that happen.

The cross-functional effect is real and unforced. Engineers, PMs, sales engineers, marketers, and security in the same session means immediate product feedback, faster “why does it work this way?” conversations, and fewer dropped handoffs. You do not have to schedule it. You schedule the build, and the conversation falls out.

Live builds surface what specs hide. Watching someone deploy a PII guardrail to their personal Slack bot, in real time, while three other engineers narrate the missing UX, is a richer artifact than any usability study. The bar to surfacing a paper cut is “did the driver struggle with it?” That bar is easier to clear than a Jira ticket.

The agent Build Club format, in detail

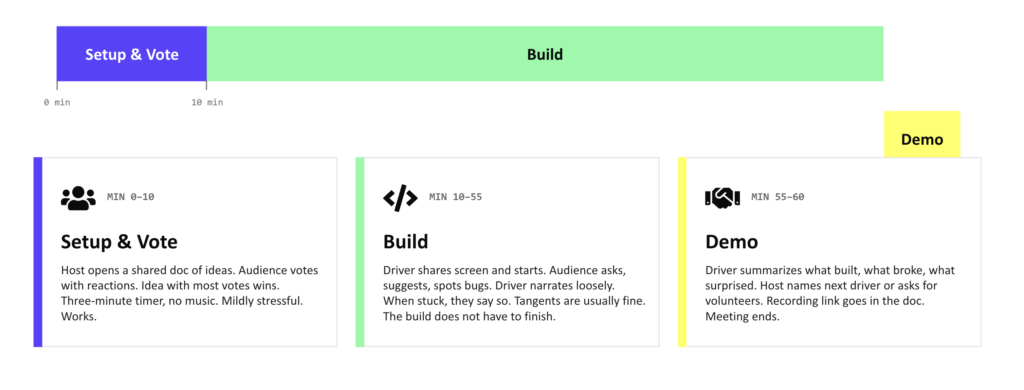
60 minutes, broken into three segments.

Agent Build Club flow

Minutes 0–10: setup and vote. The host opens. If there’s a driver lined up, they introduce themselves. The host puts a shared Google Doc on screen with a list of build ideas — some seeded ahead of time, some added live during the meeting. The audience votes with plus signs, emoji reactions, or whatever your tooling supports. The idea with the most votes wins. We use a literal three-minute timer for this. It’s mildly stressful and it works.

Minutes 10–55: build. The driver shares their screen and starts building. The audience asks questions, suggests next steps, spots bugs, and goes off on tangents. Tangents are usually fine. The driver narrates loosely as they work. When they get stuck, they say so out loud and the audience helps. There is no expectation that the build finishes. There is an expectation that something interesting happens.

Minutes 55–60: debrief and handoff. The driver summarizes what they built, what broke, what surprised them. The host announces the next driver if one is lined up, or asks for volunteers if not. Someone updates the Google Doc with the recording link and a one-line “what we built” entry. The meeting ends.

That’s it. There is no slide deck. There is no template. There is no post-meeting writeup beyond what gets pasted into the doc.

How to start an agent Build Club

If you’re going to run this at your org, here is the order of operations.

Build Club steps

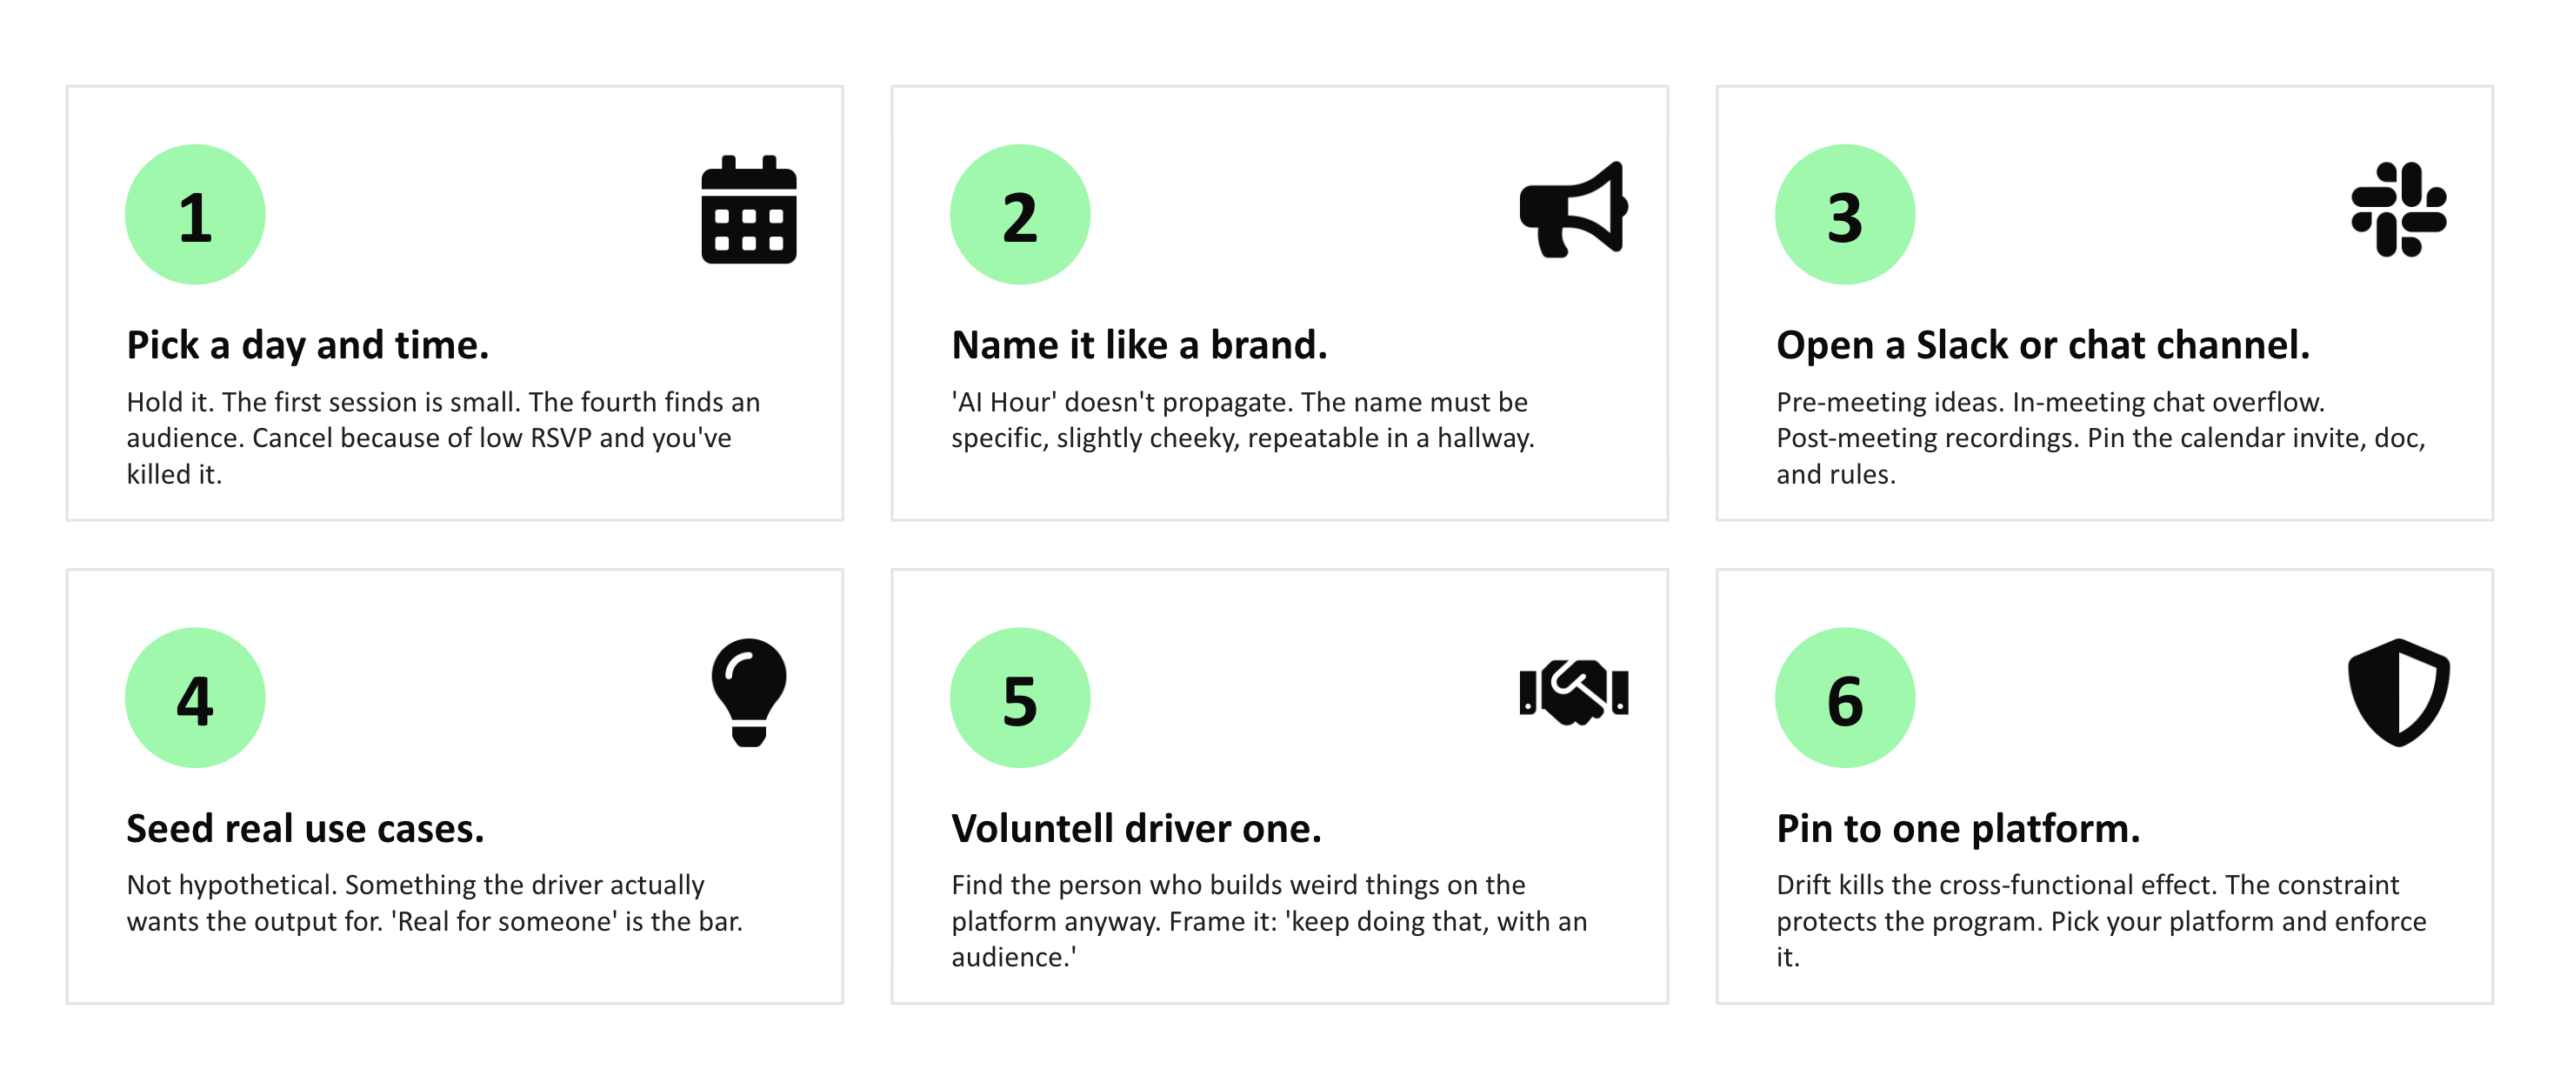
Pick a day and time and hold it. Consistency matters more than attendance. The first session will be small. The second will be smaller. The fourth will start to find an audience. The eighth will feel inevitable. If you cancel because only six people RSVP’d, you are killing the program. Run it with six people. Run it with three. The slot is the asset.

We run Friday afternoons, which is a deliberately low-energy slot. Nobody on our team is doing their best deep work on Friday at 3 PM. They are, however, willing to watch someone else build something weird while they finish their afternoon coffee. Pick the slot in your org’s week where focused work has already collapsed.

Name it something you’d promote. This sounds trivial. It is not. The first rule of Build Club is tell everyone about Build Club, and you cannot enforce that rule if the name is “AI Hour” or “Platform Tinkering Time.” The name needs to be specific, slightly cheeky, and memorable enough that someone hearing it in a hallway conversation can find the Slack channel. Build Club works because it has a name people repeat.

Open a Slack channel. Channel does double duty. Before the meeting, it’s where ideas get dropped. During the meeting, it’s where the chat overflow goes (your videoconferencing chat will not be enough). After, it’s where the recording and the debriefs live. Pin the channel description with the calendar invite, the doc, and the rules. Keep the rules to three.

Ours is #build-club in our internal Slack, but we also have a similar channel in the DataRobot Community Slack. If you’d rather brainstorm before you start your own, that’s the place. The channel is the connective tissue between the weekly hour and the rest of the week, and it’s worth setting up before your first session, not after.

Seed the first few sessions with ideas. A use case that’s relevant to someone in the room. Not a hypothetical, not a stretch demo — something where the driver actually wants the output. Our first session was Carson, an engineering leader at DataRobot, building a digital-twin Slack bot to triage his own unread DMs. The use case was real for him.  

“I have Slack problems. Let me see how many unread DMs I have right now. 284 unread DMs on Slack and group channels and thread mentions. It’s a problem.”

Real-for-someone is the bar. If you don’t have a real-for-someone idea, you do not have a Build Club yet; you have a slot.

Pick the first driver. Recruiting a stranger to drive a brand-new program over your back is hard. Find someone on your team who builds for fun anyway and tell them they’re driving the first one. They will say yes if you frame it correctly. The frame is: “you build weird things on the platform, you should keep doing that, but with an audience.” Carson built Carson-as-a-Service (CaaS) without anyone asking him to; the only thing we did was give him an hour of an audience.

Decide what people are allowed to build on. We require that the build use the DataRobot platform. This is a deliberate constraint, and it is the second of our three rules. If you don’t pin it to your platform, drift is inevitable: someone will spend a session on a side project that has nothing to do with the work, and the cross-functional learning effect will dilute. The constraint protects the program. Pick yours.

The three rules

We keep the rules short on purpose. Anything longer than three becomes a policy document.

  1. Tell everyone about Build Club.
  2. Build the thing on the platform.
  3. It does not have to work by the end.

Rule one is the marketing function. Rule two is the constraint that keeps the program useful to the business. Rule three is the permission slip that makes the driver willing to show up. Most internal demo programs die because the implicit fourth rule is “the demo has to work,” and the cost of preparing a demo that works is higher than the value the audience gets from watching it. Removing that rule is the unlock.

Common failure modes

A few patterns we’ve watched almost happen, and how we caught them.

Polishing the format. Someone will suggest a pre-meeting prep doc, a post-meeting writeup, a structured retrospective, a Notion database of outcomes, a points system for drivers. None of these things help. The format is dead simple on purpose. Every layer of process you add reduces the number of people willing to drive, because the lift to drive goes up. Resist the urge to add infrastructure.

Pre-recording the build. Someone will, in good faith, propose that the driver prepare and rehearse so the session goes more smoothly. This is the same thing as canceling Build Club. The whole point is the unpolish. A driver who has rehearsed is doing a demo, and demos are exactly what your org already has too many of.

Letting the audience get passive. If the chat goes quiet, the host has to fish. Ask the driver out loud why they made a choice. Ask the room if anyone has hit the same friction before. Ping a specific person who knows something the driver doesn’t. The audience-as-help is the format’s value, and it doesn’t sustain itself without a host who’s willing to be slightly annoying about it.

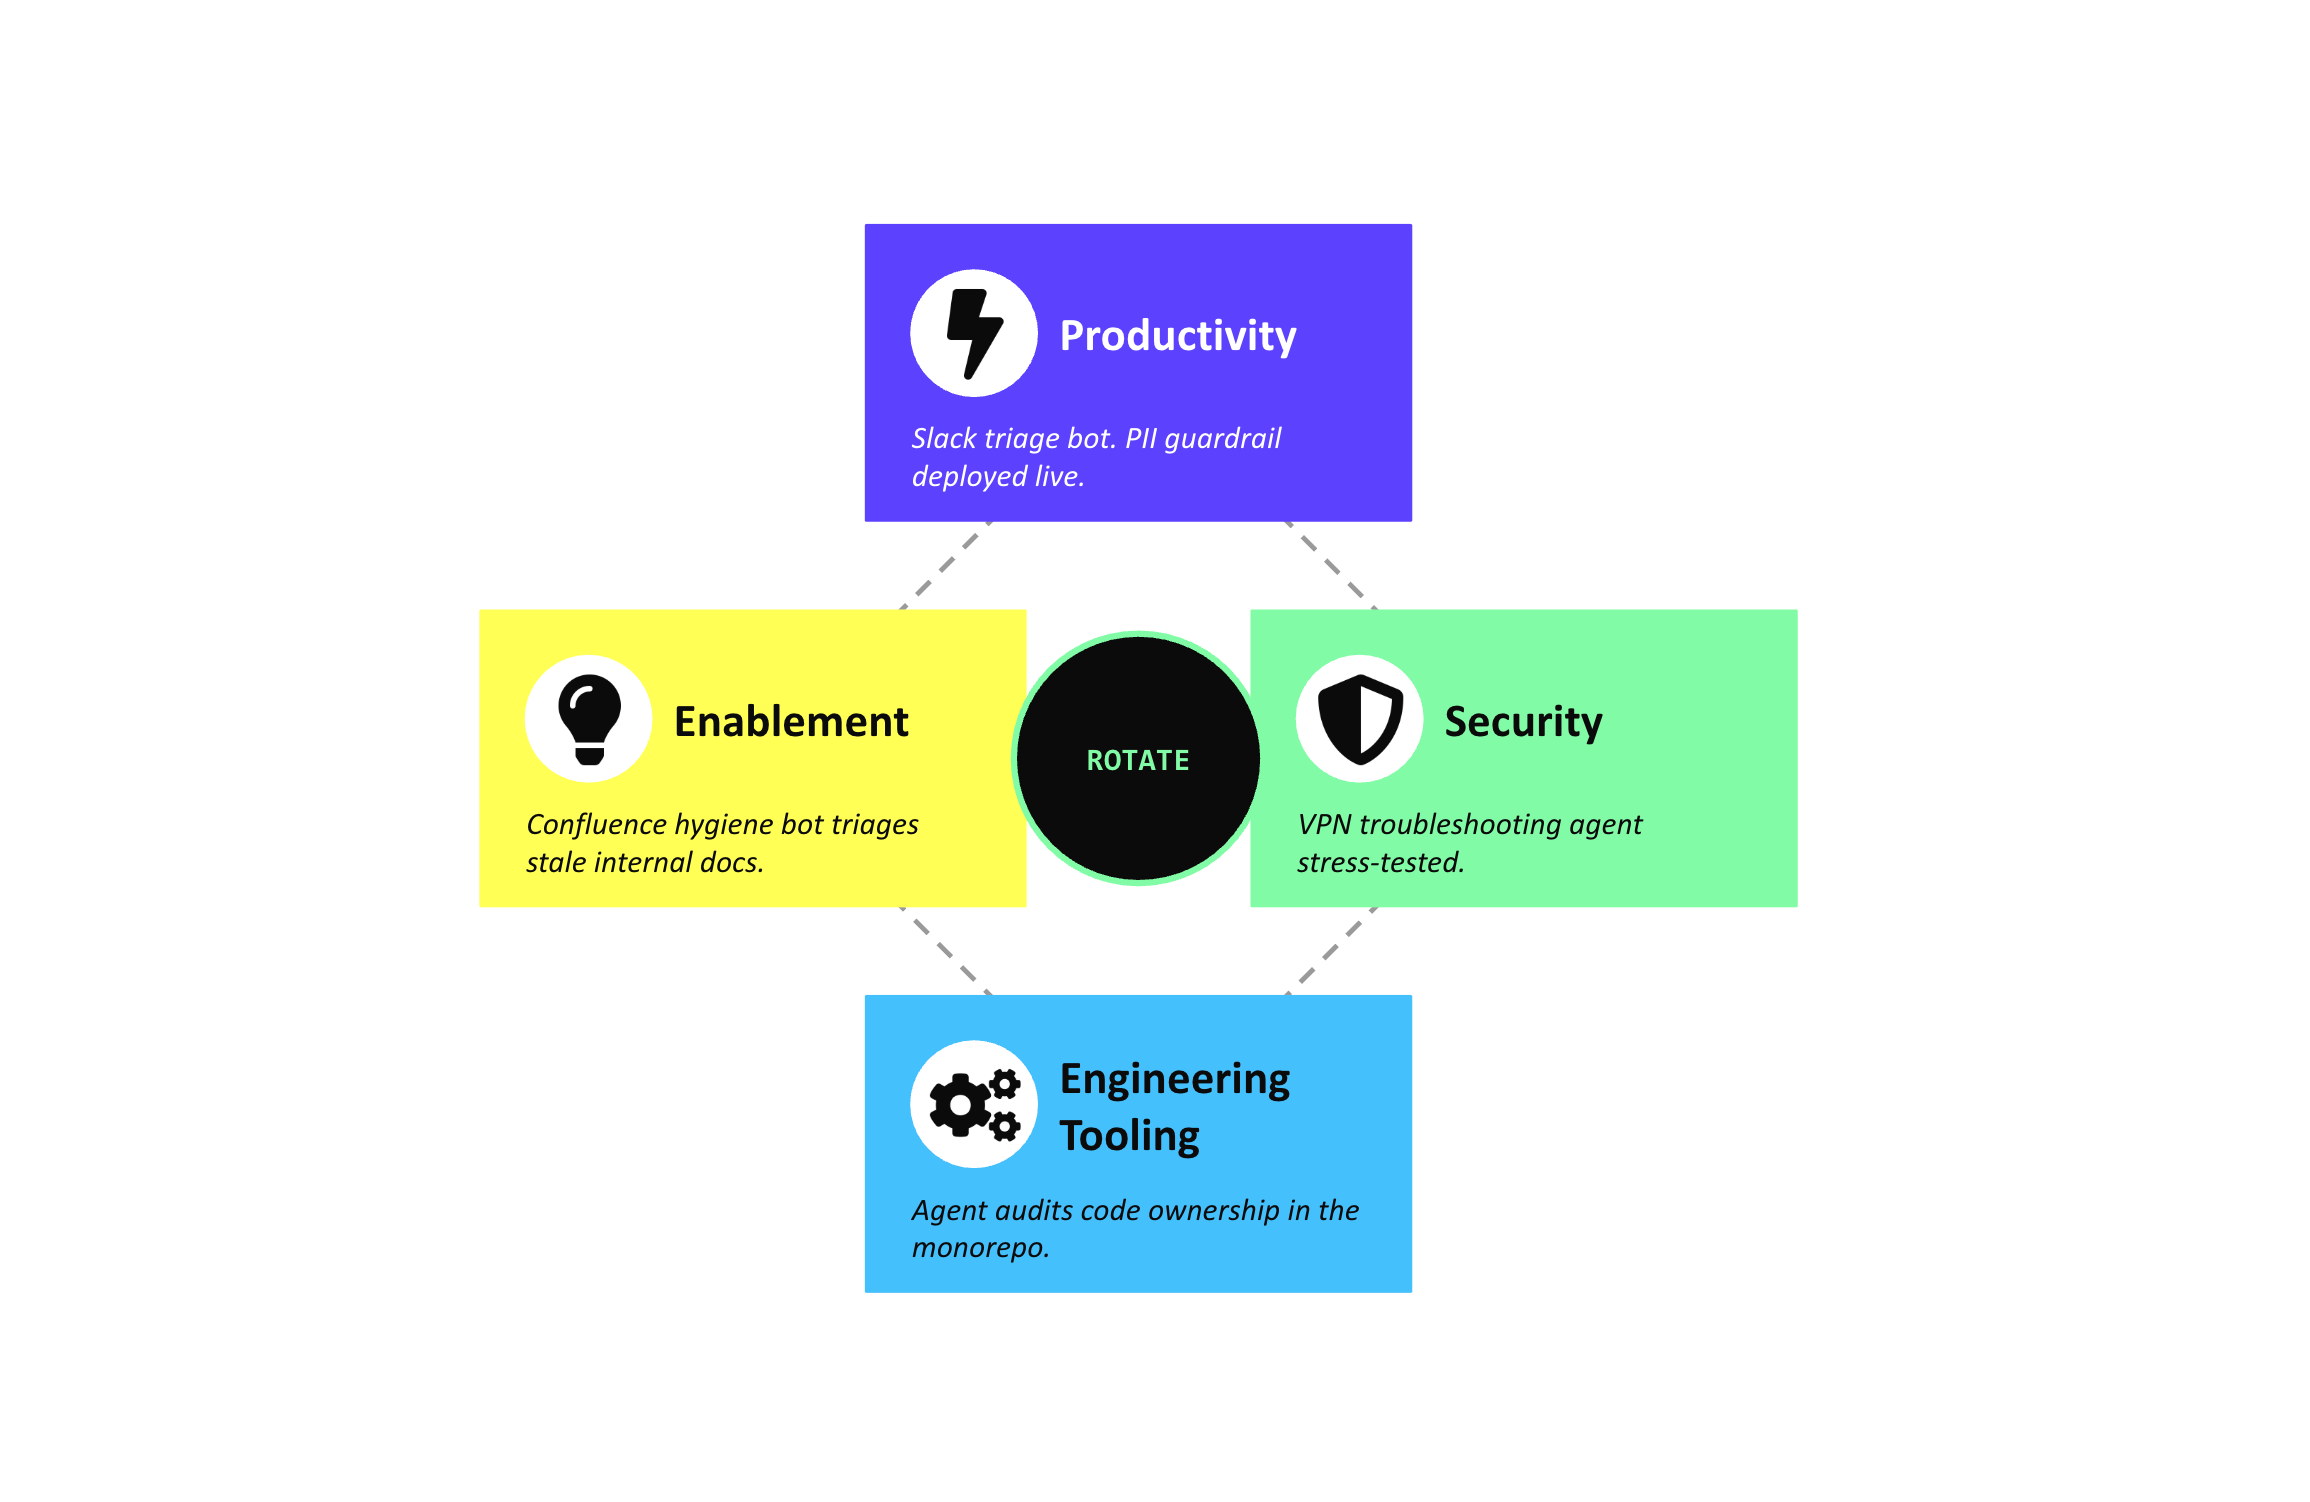
Theming too tightly. We rotate themes loosely (productivity, security, enablement, engineering tooling, and back around) so the series builds a thread. We do not enforce themes. If the audience votes for a use case that has nothing to do with the announced theme, the audience wins. The theme is a serving suggestion, not a constraint.

Agent build club diagram

Letting drivers self-select for skill. The temptation is to recruit your best builders every week, because their sessions are the most impressive. This is a trap. Your audience needs to see normal people stumble through the platform too, because that’s what your customers are actually doing. We’ve had drivers admit on camera that they have no idea how to navigate parts of our product. Those sessions surface more useful product feedback than the polished ones.

What you should expect

The first session will be rough. The driver will get stuck on something random, the audience will be tentative, and at least one tool will fail in a way nobody anticipated. This is good. It validates the format. The polished version of the first session is the version where nobody learns anything.

By the fourth or fifth session, you’ll start to see the second-order effects. Product requests will get filed without anyone formally filing them. Engineers in different parts of the org will start collaborating on side projects that came out of a Build Club tangent. New hires will start volunteering to drive, because they want the exposure.

By month two, the program runs itself. The driver queue is full. The Slack channel has its own culture. The Google Doc has a section for next week’s ideas that fills up without anyone prompting it. You will spend more energy choosing which idea to vote on than you spend organizing the meeting.

A note on what to build with

We use DataRobot because we work at DataRobot, and the constraint that the build uses our platform is the constraint that keeps Build Club aligned with the business. Whatever platform you pick, the criterion is the same: it needs to be a thing your org actually uses, and it needs to have enough surface area that a person can do something interesting with it in 45 minutes. Agent frameworks, MCP servers, the LLM gateway, eval tooling, observability — anything that an engineer can wire together against a real problem qualifies.

The next four posts

The rest of this series is the proof of concept. Four recaps, one per theme, each anchored to a session that actually happened.

Productivity, where Carson built a Slack-listening digital twin and we deployed a PII guardrail to it live, on camera, after someone sent it a fake password. Enablement, where Zach started building a Confluence hygiene bot to triage the kind of stale internal docs every enterprise has too many of. Engineering tooling, where Luke and Madeleine pointed an agent at our monorepo to audit code ownership without a single hand-written tool. And security, where Shreya and Brian spent an hour stress-testing what a VPN troubleshooting agent should and should not be allowed to do.

None of those sessions had a prep doc. All of them produced something we’re still using. That is the entire pitch.

The first rule of Build Club is tell everyone about Build Club. If you start one, we’d like to hear how it goes — drop into #build-club in the DataRobot Community Slack and tell us what you’re building. If you want to watch ours before you run your own, the recordings and idea pool live in the same channel.

Build Club, not Fight Club.

The post A playbook to run an agent Build Club appeared first on DataRobot.

Why enterprise AI ROI starts with observability

You’ve scaled deployments, your models are performing, and someone in the boardroom asks about the ROI. The honest answer is harder to give than it should be.

Not because the results aren’t there, but because the visibility isn’t.

Technical metrics like accuracy and latency tell part of the story, but they can’t tell you whether AI decisions are driving revenue, leaking cost, or quietly compounding risk. When AI operates as a black box, ROI becomes a guessing game. In enterprise environments, that’s not a sustainable position.

AI observability changes that. It connects model behavior to business outcomes, including revenue impact, cost efficiency, operational performance. This piece covers what that requires, where most organizations fall short, and what purpose-built observability actually looks like at enterprise scale.

Key takeaways

  • AI observability is essential for tying model behavior directly to business outcomes, enabling enterprises to measure ROI with clarity and precision.
  • Effective observability requires specialized tools that monitor drift, data quality, decision paths, cost impact, and real-time business performance, not just technical uptime.
  • Core features such as automated monitoring, cost correlation dashboards, and real-time root-cause analysis help enterprises prevent revenue loss, reduce operational waste, and optimize total cost of ownership.
  • Common enterprise pitfalls like only monitoring technical metrics, failing to update governance policies, or ignoring long-term sustainability costs can undermine ROI without the right observability framework.

What is AI observability, and why ROI depends on it

AI observability gives you visibility into the complete lifecycle: data inputs, model decisions, prediction outputs, and the business outcomes those decisions produce. That last part is what separates observability from traditional monitoring, which treats AI as a static component and tracks whether it’s running, not whether it’s working. 

For agentic AI, the stakes are higher. Observability must capture reasoning traces, tool call sequences, and decision confidence scores. When agents make multi-step decisions with real financial consequences, you can’t manage what you can’t see.

When a model drifts or an agent takes an unexpected action path, observability tells you what happened, why it happened, and what it cost. Without it, enterprises pour resources into model improvements that don’t move business metrics while missing the degradations that quietly erode value.

How well AI pays for itself depends less on model quality than on your ability to see how model behavior translates to business outcomes.

Core features that drive ROI in AI observability tools

Not all observability features are created equal. The ones that matter connect AI behavior directly to financial outcomes.

Automated model monitoring

Automated systems that track drift, accuracy, and data quality catch problems before they impact revenue or trigger compliance failures at a scale manual monitoring simply can’t match.

For agentic systems, monitoring must go further. It should cover MCP server connection health, tool invocation success rates, and agent reasoning chains. An agent can maintain technical accuracy while its behavior drifts in ways that only purpose-built monitoring will catch.

The business case is direct: engineering hours shift from firefighting to innovation, revenue is preserved through early intervention, and compliance penalties are avoided through continuous verification. The most effective setups tie alerts to business thresholds like margin leakage, conversion drops, SLA penalties, or fraud-loss ceilings, not just accuracy or latency.

Cost correlation dashboards

When every token, API call, and compute cycle carries a price tag, visibility stops being a nice-to-have. Cost correlation dashboards connect resource consumption to business value in real time, surfacing ROI per use case, cost per prediction, and efficiency trends that reveal where to optimize before costs compound.

The result: cost management shifts from a reactive finance exercise to a live lever for profitability.

Real-time alerts and root-cause analysis

When AI systems fail, every minute of diagnosis time has a cost. Effective observability doesn’t just flag technical failures. It quantifies their business impact and traces issues back to the specific model, pipeline component, or dataset causing the problem.

That turns hours of investigation into minutes, and minutes into preserved revenue.

Consumption-based cost tracking

As consumption-based AI pricing becomes standard, token-level cost attribution, API call volume monitoring, and cost-per-decision metrics shift from optional to essential. 

This tracking prevents budget surprises, enables accurate chargebacks to business units, and surfaces opportunities before high-cost workflows become financial liabilities.

Why specialized AI observability tools outperform general monitoring

A model can be running perfectly and still not be working. That’s because risk in AI systems has moved from the infrastructure layer to the reasoning layer — and general monitoring wasn’t built to follow it there.

General monitoring answers one question: is it running? Specialized AI observability answers a different one: is it creating value, and if not, why?

Traditional application performance monitoring (APM) tools miss the signals that matter most in AI environments: drift patterns, reasoning paths, cost dynamics specific to AI workloads, and multi-agent orchestration visibility. 

When you scale from five to 500+ agents, you need centralized observability that tracks cross-agent interactions, resource contention, and cascading failures. More importantly, you need to trace a business outcome back through every agent that contributed to it. General monitoring tools can’t do that.

Common pitfalls that undermine AI ROI

Even with the right tools in place, enterprises fall into patterns that quietly erode AI value. Most share the same root cause: technical performance gets measured while business impact doesn’t. 

Monitoring only technical metrics

High-accuracy models make costly business mistakes every day. The reason is straightforward: not all errors carry equal business weight. 

A model that’s 99% accurate, but fails on your highest-value transactions destroys more value than one that’s 95% accurate but handles critical decisions correctly. Technical metrics alone create a false sense of performance.

The fix is business context. Weight errors by revenue impact, customer importance, or operational cost, and track metrics that reflect what actually matters to your bottom line. 

Failing to update governance policies

Static governance policies have a shelf life. As models evolve and business conditions change, policies that once protected value can begin to constrain it or, worse, fail to catch emerging risks.

When drift patterns emerge, decision boundaries shift, or usage patterns change, your governance framework needs to adapt. Observability makes that possible by connecting performance metrics to governance controls, creating a feedback loop that keeps policies aligned with what’s actually happening in production.

Neglecting long-term sustainability costs

The true cost of AI emerges over time. Retraining frequency, compute scaling, and data growth all compound in ways that initial deployments obscure.

Observability surfaces these trends early, showing which models need frequent retraining, which agents consume disproportionate resources, and which workflows generate escalating costs. That visibility turns cost management from reactive to proactive, letting teams right-size resources and consolidate workflows before inefficiency hits the bottom line.

Integrating AI observability with governance and security

Observability doesn’t deliver its full value in isolation. Integrated with enterprise governance and security frameworks, it becomes the connective tissue between AI performance, risk management, and business accountability. 

Governance capabilities

Observability platforms need to do more than track performance. They must provide the audit trails, version control, bias monitoring, and explainability that enterprise governance requires.

In regulated industries, the requirement is stricter. Observability data must be auditable and reproducible, not just logged. Financial services firms operating under FINRA and SEC requirements need complete decision lineage: the ability to show how an agent arrived at a recommendation and reconstruct the inputs, tool calls, and outputs behind it.

And because enterprise stacks are rarely single-cloud, that same standard must follow models and agents across on-premises and multi-cloud deployments without adding prohibitive latency to production workflows.

Security integration

Observability data is sensitive by nature, and protecting it requires role-based access controls, encryption, and sensitive data masking. But the bigger opportunity is integration: connecting AI observability with SIEM and GRC platforms brings AI visibility directly into security team workflows. 

Enterprise-grade platforms support webhook forwarding of real-time alerts to SOC teams, structured log formats for security analytics, and anomaly detection that flags potential prompt injection or data exfiltration attempts.

This integration reduces MTTD, MTTI, and MTTR, turning AI from a security blind spot into a well-monitored part of the enterprise security posture. 

Turning AI observability into enterprise-wide impact

In a DataRobot study of nearly 700 AI professionals, 45% cited confidence, monitoring, and observability as their single biggest unmet need — ranking it above implementation, integration, and collaboration combined. 

The visibility gap is real, and it’s widespread.

Organizations that close it gain something their competitors don’t have: the ability to connect every AI decision to a business outcome, defend every investment, and course-correct before problems compound. Those that don’t will keep answering the same boardroom question without a satisfying answer.

Purpose-built observability isn’t a feature. It’s the foundation your AI strategy depends on.

See what nearly 700 AI professionals said about the observability gap.

FAQs

How does AI observability differ from traditional monitoring?

Traditional monitoring focuses on system health, including uptime, CPU usage, and latency. It does not explain why models make certain decisions or how those decisions affect business outcomes. AI observability captures drift, decision paths, data quality changes, and business KPI impact, making it possible to measure ROI and operational reliability with more precision.

Do I need AI observability if my models already perform well?

Yes. High-performing models can still produce costly mistakes if data changes, business rules evolve, or market conditions shift. Observability surfaces early indicators of risk, preserves revenue, and reduces the operational burden of manual checks, even when accuracy appears stable.

How do observability tools quantify the ROI of AI systems?

They directly link prediction performance, latency, and cost metrics to business KPIs such as revenue impact, cost savings, customer retention, and operational efficiency. Cost correlation dashboards and attribution models reveal the financial value created or lost by each AI workflow.

Can AI observability support compliance and governance requirements?

Yes. Modern observability tools include audit trails, version history, bias monitoring, explainability, and data privacy controls. These capabilities provide the transparency regulators require and help enterprises align AI operations with governance frameworks.

What should I look for in an enterprise-grade AI observability platform?

Look for platforms that offer code-first APIs for programmatic metric export, CI/CD pipeline integration, and version-controlled deployment configuration. Equally important is cross-environment consistency: the same observability standards should apply whether models run on-premises, on AWS, or on Azure. As agent deployments scale, centralized visibility across all environments stops being a nice-to-have and becomes an operational requirement.

The post Why enterprise AI ROI starts with observability appeared first on DataRobot.

Agentic AI Observability: The Foundation of Trusted Enterprise AI

Your agentic AI systems are making thousands of decisions every hour. But can you prove why they made those choices?

If the answer is anything short of a documented, reproducible explanation, you’re not experimenting with AI. Instead, you’re running unmonitored autonomy in production. And in enterprise environments where agents approve transactions, control workflows, and interact with customers, operating without visibility can create major systemic risk. 

Most enterprises deploying multi-agent systems are tracking basic metrics like latency and error rates and assuming that’s enough. 

It isn’t. 

When an agent makes a series of wrong decisions that quietly cascade through your operations, those metrics don’t even scratch the surface. 

Observability isn’t a “nice-to-have” monitoring tool for agentic AI. It’s the foundation of trusted enterprise AI. It’s the line between controlled autonomy and uncontrolled risk. It’s how builders, operators, and governors share one reality about what agents are doing, why they’re doing it, and how those choices play out across the build → operate → govern lifecycle. 

Key takeaways

  • Multi-agent systems break traditional monitoring models by introducing hidden reasoning and cross-agent causality.
  • Agentic observability captures why decisions were made, not just what happened.
  • Enterprise observability reduces risk and accelerates recovery by enabling root-cause analysis across agents.
  • Integrated observability enables compliance, security, and governance at production scale.
  • DataRobot provides a unified observability fabric across agents, environments, and workflows.

What is agentic AI observability and why does it matter?

Agentic AI observability gives you full visibility into how your multi-agent systems think, act, and coordinate. Not just what they did, but why they did it.

Monitoring what happened is just the start. Observability shows what happened and why at the application, session, decision, and tool levels. It reveals how each agent interpreted context, which tools it selected, which policies applied, and why it chose one path over another.

Enterprises often claim they trust their AI. But trust without visibility is faith, not control

Why does this matter? Because you can’t trust your AI if you can’t see the reasoning, the decision pathways, and the tool interactions driving outcomes that directly affect your customers and bottom line.

When agents are handling customer inquiries, processing financial transactions, or managing supply chain decisions, you need ironclad confidence in their behavior and visibility into the entire process, not just little individual pieces of the puzzle.

That means observability must be able to answer specific questions, every time:

  • Which agent took which action?
  • Based on what context and data?
  • Under which policy or guardrail?
  • Using which tools, with what parameters?
  • And what downstream effects did that decision trigger?

AI observability delivers those answers. It gives you defensible audit trails, accelerates debugging, and establishes (and maintains) clear performance baselines.

The practical benefits show up immediately for practitioners: faster incident resolution, reduced operational risk, and the ability to scale autonomous systems without losing control. 

When incidents occur (and they will), observability is the difference between rapid containment and serious business disruption you never saw coming.

Why legacy monitoring is no longer a viable solution

Legacy monitoring was built for an era when AI systems were predictable pipelines: input in, output out, pray your model doesn’t drift. That era is gone. Agentic systems reason, delegate, call tools, and chain their decisions across your business.

Here’s where traditional tooling collapses:

  • Silent reasoning errors that fly under the radar. Let’s say an agent hits a prompt edge case or pulls in incomplete data. It starts making confident but wrong decisions.

Your infrastructure metrics look perfect. Latency? Normal. Error codes? Clean. Model-level performance? Looks stable. But the agent is systematically making wrong choices under the hood, and you have no indication of that until it’s too late. 

  • Cascading failures that hide their origins. One forecasting agent miscalculates. Planning agents adjust. Scheduling agents compensate. Logistics agents react. 

By the time humans notice, the system is tangled in failures. Traditional tools can’t trace the failure chain back to the origin because they weren’t designed to understand multi-agent causality. You’re left playing incident whack-a-mole while the real culprit hides upstream. 

The bottom line is that legacy monitoring creates massive blind spots. AI systems operate as de facto decision-makers, use tools, and drive outcomes, but their internal behavior remains invisible to your monitoring stack. 

The more agents you deploy, the more blind spots, and the more opportunities for failures you can’t see coming. This is why observability must be designed as a first-class capability of your agentic architecture, not a retroactive fix after problems surface.

How agentic AI observability works at scale

Introducing observability for one agent is simple. Doing it across dozens of agents, multiple workflows, multiple clouds, and tightly regulated data environments? That gets harder as you scale. 

To make observability work in real enterprise settings, ground it in a simple operating model that mirrors how agentic AI systems are managed at scale: build, operate, and govern. 

Observability is what makes this lifecycle viable. Without it, building is guesswork, operating is risky, and governance is reactive. With it, teams can move confidently from creation to long-term oversight without losing control as autonomy increases. 

We think about enterprise-scale agentic AI observability in four mandatory layers: application-level, session-level, decision-level, and tool-level. Each layer answers a different question, and together they form the backbone of a production-ready observability strategy.

Application-level visibility

At the agentic application level, you’re tracking entire multi-agent workflows end to end. This means understanding how agents collaborate, where handoffs occur, and how orchestration patterns evolve over time.

This level reveals the failure points that only emerge from system-level interactions. For example, when every agent appears “healthy” in isolation, but their coordination creates bottlenecks and deadlocks. 

Think of an orchestration pattern where three agents are all waiting on each other’s outputs, or a routing policy that keeps sending complex tasks to an agent that was designed for simple triage. Application-level visibility is how you spot these patterns and redesign the architecture instead of blaming individual components.

Session-level insights

Session-level monitoring follows individual agent sessions as they navigate their workflows. This is where you capture the story of each interaction: which tasks were assigned, how they were interpreted, what resources were accessed, and how decisions moved from one step to the next.

Session-level signals reveal the patterns practitioners care about most:

  • Loops that signal misinterpretation
  • Repeated re-routing between agents
  • Escalations triggered too early or too late
  • Sessions that drift from expected task counts or timing

This granularity lets you see exactly where a workflow went off track, right down to the specific interaction, the context available at that moment, and the chain of handoffs that followed.

Decision-level reasoning capture

This is the surgical layer. You see the logic behind choices: the inputs considered, the reasoning paths explored, the options rejected, the confidence levels applied.

Instead of just knowing that “Agent X chose Action Y,” you understand the “why” behind its choice, what information influenced the decision, and how confident it was in the outcome. 

When an agent makes a wrong or unexpected choice, you shouldn’t need a war room to figure out why. Reasoning capture gives you immediate answers that are precise, reproducible, defensible. It turns vague anomalies into clear root causes instead of speculative troubleshooting.

Tool-interaction monitoring

Every API call, database query, and external interaction matters. Especially when agents trigger those calls autonomously. Tool-level monitoring surfaces the most dangerous failure modes in production AI:

  • Query parameters that drift from policy
  • Inefficient or unauthorized access patterns
  • Calls that “succeed” technically but fail semantically
  • Performance bottlenecks that poison downstream decisions

This level sheds light on performance risks and security concerns across all integration points. When an agent starts making inefficient database queries or calling APIs with suspicious parameters, tool-interaction monitoring flags it immediately. In regulated industries, this isn’t optional. It’s how you prove your AI is operating within the guardrails you’ve defined.

Best practices for agent observability in production

Proofs of concept hide problems. Production exposes them. What worked in your sandbox will collapse under real traffic, real customers, and real constraints unless your observability practices are designed for the full agent lifecycle: build → operate → govern.

Continuous evaluation

Establish clear baselines for expected agent behavior across all operational contexts. Performance metrics matter, but they’re not enough. You also need to track behavioral patterns, reasoning consistency, and decision quality over time.

Agents drift. They evolve with prompt changes, context changes, data changes, or environmental shifts. Automated scoring systems should continuously evaluate agents against your baselines, detecting behavioral drift before it impacts end users or outcomes that impact business decisions. 

“Behavioral drift” looks like:

  • A customer-support agent gradually issuing larger refunds at certain times of day
  • A planning agent becoming more conservative in its recommendations after a prompt update
  • A risk-review agent escalating fewer cases as volumes spike 

Observability should surface those shifts early, before they cause damage. Include regression testing for reasoning patterns as part of your continuous evaluation to make sure you’re not unintentionally introducing subtle decision-making errors that get worse over time.

Multi-cloud integration

Enterprise observability can’t stop at infrastructure boundaries. Whether your agents are running in AWS, Azure, on-premises data centers, or air-gapped environments, observability must provide a coherent, cross-environment picture of system health and behavior. Cross-environment tracing, which means following a single task across systems and agents, is non-negotiable if you expect to detect failures that only emerge across boundaries.

Automated incident response

Observability without response is passive, and passivity is dangerous. Your goal is minutes of recovery time, not hours or days. When observability detects anomalies, response should be swift, automatic, and driven by observability signals: 

  • Initiate rollback to known-good behavior.
  • Reroute around failing agents.
  • Contain drift before customers ever feel it.

Explainability and transparency

Executives, risk teams, and regulators need clarity, not log dumps. Observability should translate agent behavior into natural-language summaries that humans can understand.

Explainability is how you turn black-box autonomy into accountable autonomy. When regulators ask, “Why did your system approve this loan?” you should never answer with speculation. You should answer with evidence.

Organized governance frameworks

Structure your observability data around roles, responsibilities, and compliance requirements. Builders need debugging details. Operators need performance metrics. Governance teams need evidence that policies are followed, exceptions are tracked, and AI-driven decisions can be explained.

Observability operationalizes governance. Integration with enterprise governance, risk, and compliance (GRC) systems keeps observability data flowing into existing risk management processes. Policies become enforceable, exceptions become visible, and accountability becomes systemic.

Ensuring governance, compliance, and security for AI observability

Observability forms the backbone of responsible AI governance at enterprise scale. Governance tells you how agents should behave. Observability shows how they actually behave, and whether that behavior holds up under real-world pressure.

When stakeholders demand to know how decisions were made, observability provides the factual record. When something goes wrong, observability provides the forensic trail. When regulations tighten, observability is what keeps you compliant.

Consider the stakes:

  • In financial services, observability data supports fair lending investigations and algorithmic bias audits. 
  • In healthcare, it provides the decision trails required for clinical AI accountability. 
  • In government, it provides transparency in public sector AI deployment.

The security implications are equally important. Observability is your early-warning system for agent manipulation, resource misuse, and anomalous access patterns. Data masking and access controls keep sensitive information protected, even within observability systems.

AI governance defines what “good” looks like. Observability proves whether your agents are living up to it. 

Elevating enterprise trust with AI observability

You don’t earn trust by claiming your AI is safe. You earn it by showing your AI is visible, predictable, and accountable under real-world conditions.

Observability solutions turn experimental AI deployments into production infrastructure, being the difference between AI systems that require constant human oversight and ones that can reliably operate on their own.

With enterprise-grade observability in place, you get:

  • Faster time to production because you can identify, explain, and fix issues quickly, instead of arguing over them in postmortems without data to back you up
  • Lower operational risk because you detect drift and anomalies before they explode
  • Stronger compliance posture because every AI-driven decision comes with a traceable, explainable record of how it was made

DataRobot’s Agent Workforce Platform delivers this level of observability across the entire enterprise AI lifecycle. Builders get clarity. Operators get control. Governors get enforceability. And enterprises get AI that can scale without sacrificing trust.

Learn how DataRobot helps AI leaders outpace the competition.

FAQs

How is agentic AI observability different from model observability?

Agentic observability tracks reasoning chains, agent-to-agent interactions, tool calls, and orchestration patterns. This goes well beyond model-level metrics like accuracy and drift. It reveals why agents behave the way they do, creating a far richer foundation for trust and governance.

Do I need observability if I only use a few agents today?

Yes. Early observability reduces risk, establishes baselines, and prevents bottlenecks as systems expand. Without it, scaling from a few agents to dozens introduces unpredictable behavior and operational fragility.

How does observability reduce operational risk?

It surfaces anomalies before they escalate, provides root-cause visibility, and enables automated rollback or remediation. This prevents cascading failures and reduces production incidents.

Can observability work in hybrid or on-premises environments?

Modern platforms support containerized collectors, edge processing, and secure telemetry ingestion for hybrid deployments. This enables full-fidelity observability even in strict, air-gapped environments.

What’s the difference between observability and just logging everything?

Logging captures events. Observability creates understanding. Logs can tell you that an agent called a certain tool at a specific time, but observability tells you why it chose that tool, what context informed the decision, and how that choice rippled through downstream agents. When something unexpected happens, logs give you fragments to reconstruct while observability gives you the causal chain already connected.

The post Agentic AI Observability: The Foundation of Trusted Enterprise AI appeared first on DataRobot.